Trucking cost per kilometre Canada: the diesel variable
The trucking cost per kilometre Canada number is built from two inputs. Only one of them moves, and it swings 75.2 cents a litre across the country.

Every kilometre you drive has a fuel price baked into it. That price is the only part of the trucking cost per kilometre Canada figure that changes when you cross a provincial line. The print from Natural Resources Canada this week runs from 217.9 cents a litre in the Northwest Territories to 293.1 in Quebec.
The other input is your burn rate. That is a fact about the truck, the load and the grade. It does not care which province you filled up in.
So when somebody asks what a kilometre costs, the honest answer is that it costs your burn rate multiplied by whatever the sign said. Only the second half of that moves. This piece takes the second half apart.
What the kilometre number is actually built from
A cost per kilometre is two numbers multiplied. Litres burned per kilometre, and dollars per litre. Nothing else enters it.
Your burn rate holds steady for the day. A loaded highway tractor pulling a van will drink a set number of litres for every hundred kilometres, and that number shifts with the trailer, the weather and the hills. You know yours. Nobody can hand you a national burn rate that means anything, because it is a property of the equipment and the run.
The price per litre is the part that gets published. It is the part that changes when you fuel in Alberta instead of Ontario, and it is the part a carrier can plan around.
That is the whole mechanism. One constant you own, one variable you can work. And the variable is wide.
Trucking cost per kilometre Canada sits on a 75.2 cent spread
Natural Resources Canada runs a weekly retail diesel survey and prints one all-in price per province and territory. The Tuesday print of 29 September put the national average at 265.6 cents a litre. Here is the full board.
| Province or territory | Diesel (cents per litre) |
|---|---|
| Quebec | 293.1 |
| British Columbia | 276.2 |
| New Brunswick | 272.9 |
| Newfoundland and Labrador | 271.1 |
| Yukon | 269.9 |
| Nova Scotia | 266.7 |
| Prince Edward Island | 264.6 |
| Manitoba | 256.6 |
| Ontario | 253.8 |
| Saskatchewan | 250.8 |
| Alberta | 250.0 |
| Northwest Territories | 217.9 |
Top to bottom that is a 75.2 cent gap, on the same product, in the same week, inside one country.
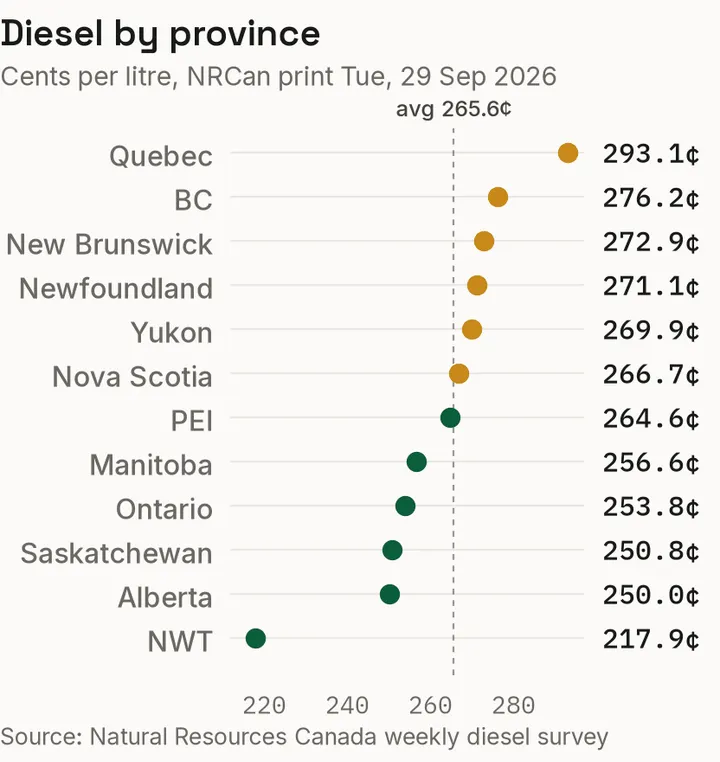
Provincial diesel prices against the national index, per the NRCan weekly survey.
Read the board by membership rather than by rank. The expensive end is coastal and Atlantic. Quebec, British Columbia, New Brunswick, Newfoundland and Labrador, Yukon, Nova Scotia and Prince Edward Island all print above the national average. The cheap end is inland and northern. Manitoba, Ontario, Saskatchewan, Alberta and Northwest Territories all print below it.
For a per-kilometre figure the table is a routing tool. The same tractor, the same van and the same stretch of highway cost different money to run depending on which side of a provincial line the fill happened. The truck did not change. The price did.
What sits inside that all-in price
The survey publishes one number per jurisdiction, and it is the retail price a driver would actually pay. Fuel tax, carbon charges where a province applies them, wholesale margin, retail margin and the cost of moving the litre to the station are already inside it. The survey does not break out the split.
Two mechanisms do most of the work in a gap this wide.
Provincial fuel taxes land on the pump price before any other margin moves. They differ by province, they change nothing about the fuel itself, and they are the single largest lever a provincial government controls. Two cardlocks on the same highway, one on each side of a provincial line, can post different prices for a delivery that came off the same truck.
Supply distance adds handling. A litre refined in Alberta or Saskatchewan starts near a plant. A litre in Newfoundland and Labrador, New Brunswick or Prince Edward Island arrives by marine or rail from somewhere else, and every transfer point adds cost.
Both land inside the same published price, and both are local facts. That is the point of the board. It tells you where the money goes, not why, and where is enough to plan a fill.
The national average is the least useful number on the page. It is 265.6 this week, and nobody fuels at a national average. It is a benchmark, not a price.
The currency sits under every price on the board
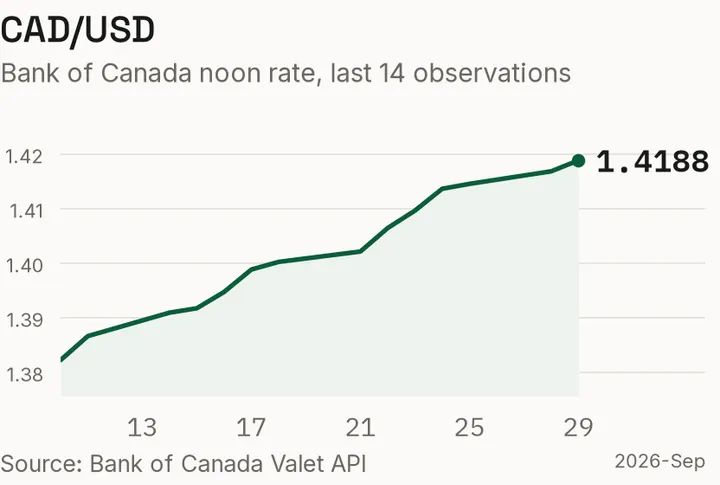
The Canadian dollar against the US dollar, recent observations.
Every litre in that table carries an American dollar somewhere inside it. Crude trades in US dollars, and so does most of the refined product that reaches the Canadian market.
The Bank of Canada put the exchange rate at 1.4188 on 29 September, with the loonie weakening 0.14 per cent. That is a small move, and it lands anyway, because a weaker loonie raises the Canadian cost of the same barrel for every province at once.
The shape of that matters. The provincial spread is a tax and logistics story, so a carrier can move lanes and capture it. The currency level is a national story, so no province taxes or subsidises its way out of it. When the loonie weakens, the whole board rises together and your kilometres get more expensive everywhere you drive.
There is a second currency number worth knowing. The US Energy Information Administration put US diesel at $6.382 a gallon. That figure is in US dollars and US gallons, so it does not convert cleanly into the cents-per-litre table above. It matters at the negotiating table, where a cross-border rate has to cover a fuel cost priced in somebody else's money.
Time at the border is a cost the sign does not show
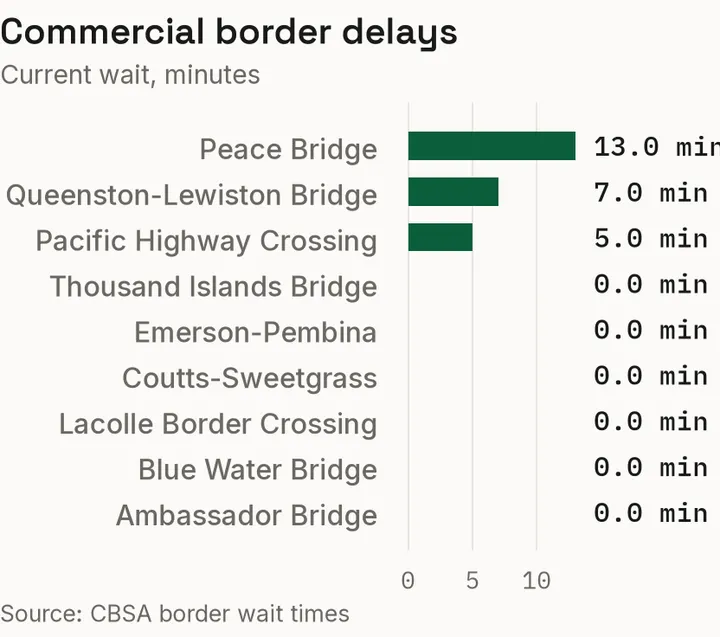
Current commercial wait times at CBSA-reported crossings.
A fuel cost per kilometre assumes the wheels are turning. A delay at a crossing breaks that assumption.
CBSA reported commercial delays at three crossings on the same print. Peace Bridge was running 13 minutes. Queenston-Lewiston was at 7. Pacific Highway was at 5. Ambassador Bridge, Blue Water Bridge, Lacolle, Coutts-Sweetgrass and Emerson-Pembina all reported clear.
Those waits are short, and none of them changes a routing decision on its own. Sit long enough at a booth, though, and the truck burns litres you never billed for. The fuel still leaves the tank and the kilometres do not get made. That is a per-kilometre increase that never shows up on a price sign.
For anyone running the Blaine corridor, Pacific Highway carries the longest reported wait of the crossings showing one.
What the arithmetic means on your own lane
You already own one of the two inputs, so work the other one.
Start with the price. The lowest litres on the board this week are the Northwest Territories at 217.9, then Alberta at 250.0 and Saskatchewan at 250.8. If your lane already touches any of those markets, build the fill into the run instead of taking whatever the highway offers. A carrier running Ontario into Quebec is buying at 253.8 on one side of the line and 293.1 on the other.
Check the city, not the province. A provincial number is an average by definition, and the street price where you actually fuel is what lands in your kilometre cost. Calgary and Montreal each carry their own page on the dashboard.
Then put your own burn rate in. This piece will not hand you a per-kilometre dollar figure, because the answer depends on litres per 100 kilometres, and that is a property of your truck and your load rather than a published price. The fuel cost calculator takes your distance, your burn rate and the price on the sign and returns the per-lane cost.
The short version
A fuel cost per kilometre is two numbers multiplied. Your burn rate is stable and it is yours. The price per litre is what moves, and this week it moves 75.2 cents from the top of the country to the bottom. Work the price side of the trucking cost per kilometre Canada arithmetic. Fill on the cheap side of the line when the routing allows. Watch the loonie, because it moves every province at once. And keep half an eye on the crossing, because a parked truck burns fuel and covers no ground.
Live diesel prices by province and by city, current commercial wait times at every tracked crossing and the per-lane calculator are all on the dashboard, free, with no login.
Sources: Natural Resources Canada weekly diesel survey (retail diesel, Tuesday print of 29 September). Bank of Canada exchange rate series. CBSA border wait times. US Energy Information Administration weekly diesel price. Methodology, including how the national average is calculated: https://dashboard.northernmilemedia.com/methodology/nmdi/