Diesel price by province Canada: the 77.8 cent gap
What diesel costs in every Canadian province this week, from the Natural Resources Canada weekly survey, with the spread between the cheapest and dearest province and what it costs on a 500-litre fill.

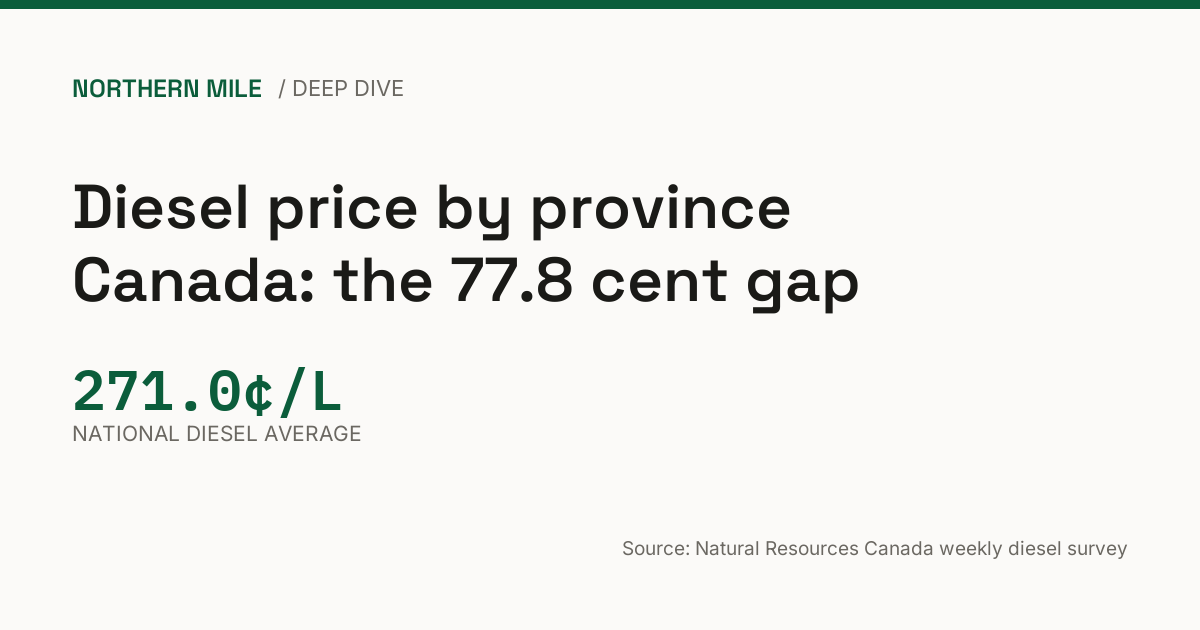
Natural Resources Canada's weekly diesel survey put the national average at 271.0 cents a litre on Tuesday, 22 September. It is the number most people quote. It is also the least useful one.
Look at the diesel price by province and Canada stops behaving like a single market. Quebec printed 296.6 cents a litre. The Northwest Territories printed 218.8. Same product, same week, same survey. The distance between those two numbers is 77.8 cents a litre.
That is a wide spread for one product in one country. It is not random either. Once you know which levers sit inside a pump price, the ranking stops looking strange and starts looking like policy, logistics and a bit of currency.
Diesel price by province Canada, ranked
Every province and territory reported into the Natural Resources Canada survey on the Tuesday print. Here is the full board.
| Province or territory | Diesel (cents per litre) |
|---|---|
| Quebec | 296.6 |
| Newfoundland and Labrador | 283.2 |
| British Columbia | 283.1 |
| New Brunswick | 279.6 |
| Prince Edward Island | 279.2 |
| Nova Scotia | 273.9 |
| Ontario | 261.1 |
| Manitoba | 255.4 |
| Saskatchewan | 250.6 |
| Yukon | 249.9 |
| Alberta | 247.3 |
| Northwest Territories | 218.8 |
National average is 271.0 cents a litre. Quebec holds the top of the table. Northwest Territories holds the bottom.
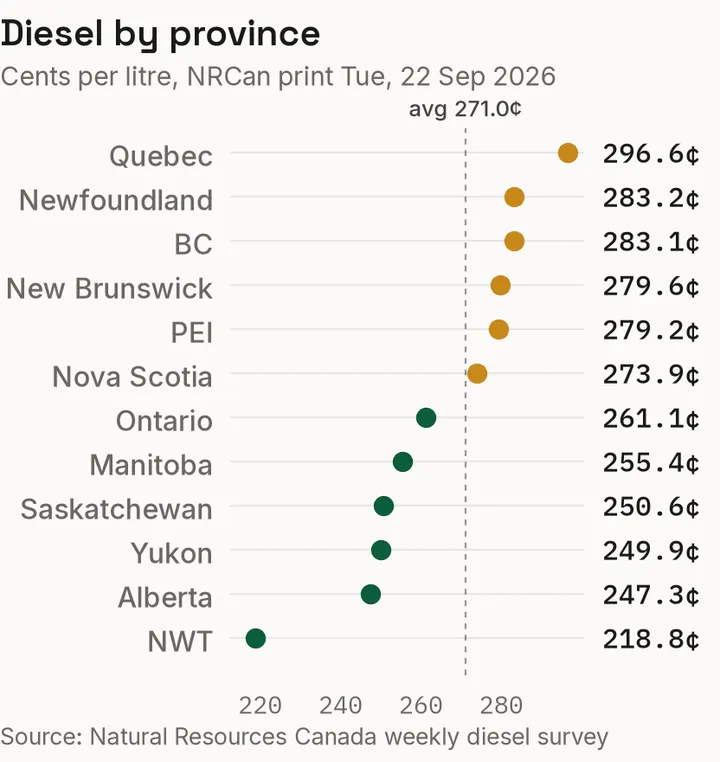
Provincial diesel prices against the national index, per the NRCan weekly survey.
Read the shape of it rather than the order. The expensive end is coastal. Newfoundland and Labrador, British Columbia, New Brunswick, Prince Edward Island and Nova Scotia all sit toward the top, and four of those five load refined product off a dock or a rail car. The cheap end is inland and northern. Ontario, Manitoba, Saskatchewan, Yukon, Alberta and Northwest Territories all sit below the national average, and most of them sit close to a refinery.
Then Quebec sits at the very top anyway, and that is where the simple story breaks.
What is actually inside the number
The survey publishes one figure per province. It is an all-in retail price. Fuel tax, carbon charges where a province applies them, wholesale margin, retail margin and the cost of getting the litre to the station are already inside it. The survey does not publish the split.
So the table tells you where the gap is. It does not tell you which component created it. Three mechanisms do most of the work in a spread this wide.
Tax. Every province sets its own fuel tax, and it lands on the pump price before any other margin moves. That is the largest single lever a provincial government controls, and it changes nothing about the fuel itself. Two stations on the same highway, one on each side of a provincial line, can post different prices for a delivery that came off the same truck.
Supply distance. A litre refined in Alberta or Saskatchewan starts near a plant. A litre in Newfoundland and Labrador, New Brunswick or Prince Edward Island arrives by marine or rail from a refinery somewhere else, and every transfer point adds handling. Alberta and Saskatchewan sit on top of the refining capacity that serves them, which is one reason both print low.
Competition. A town with several cardlocks and truck stops bidding for the same freight prices tighter than a town with one cardlock on the highway. That effect is real and it is invisible in a provincial average.
Quebec is the test case. It sits at the top of the table at 296.6 cents a litre, and it has a domestic refining sector within its own borders. Distance to supply does not explain that position. What Quebec puts on a litre does, and the Quebec diesel page carries the city-level detail behind that figure. So does British Columbia, which is coastal and refining-equipped and still prints 283.1.
The north is the more interesting puzzle
Northwest Territories is the cheapest jurisdiction in the country at 218.8 cents a litre. It is also about as far from its supply as anywhere on the list. Distance alone cannot explain the bottom of the table.
Yukon sits one border over at 249.9. Same climate. Same short construction season. Same long supply lines into the territory. Whatever separates those two numbers, it is not geography.
Both territories run their own fuel programs and their own tax treatment, and those choices land at the pump. That is the honest read of the north. It is a policy result, not a logistics result.
The currency layer underneath all of it
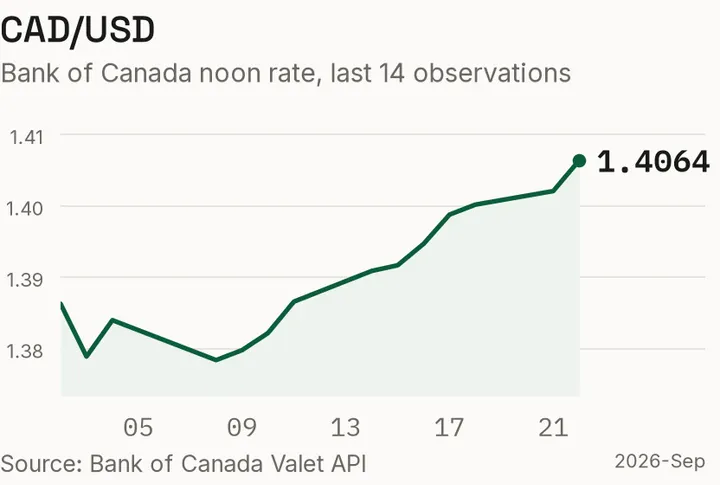
The Canadian dollar against the US dollar, recent observations.
The Bank of Canada put the exchange rate at 1.4064 on 22 September, with the loonie weakening 0.31 per cent against the US dollar.
Every litre in that table has a US dollar somewhere inside it. Crude trades in US dollars, and so does most of the refined product that moves into the Canadian market. A weaker loonie raises the Canadian cost of the same barrel, and it does that to every province at once. No province taxes or subsidises its way out of a currency move.
That is why the exchange rate belongs in a conversation about provincial diesel. The spread across provinces is a tax and logistics story. The level of the whole table is a currency story. Alberta at 247.3 and Ontario at 261.1 are the cheap litres in the country. The exchange rate moves both of them, along with everything above them.
There is a second currency number worth knowing. The EIA put US diesel at $6.529 a gallon. That figure is in US dollars and US gallons, so it does not drop into the table above without a conversion this piece is not going to do. It matters at the negotiating table, where a cross-border rate has to cover a fuel cost that is priced in somebody else's money.
The border layer
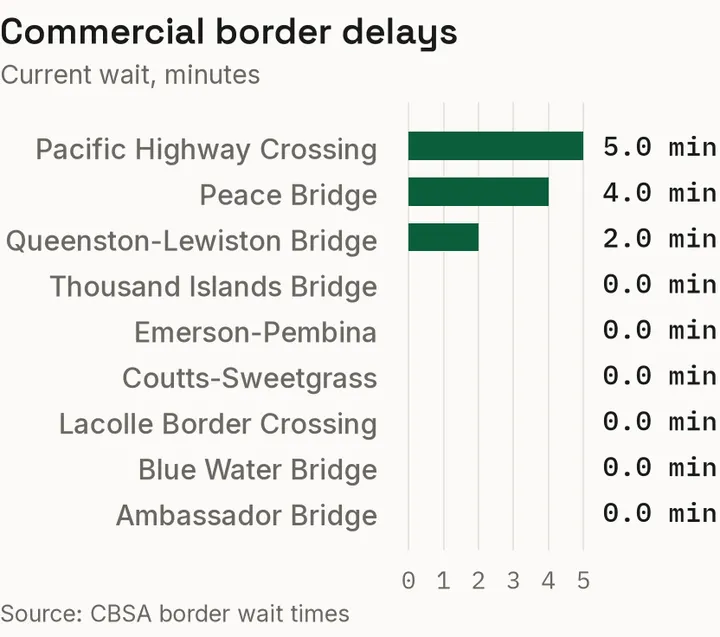
Current commercial wait times at CBSA-reported crossings.
Fuel has to arrive before it can be sold, and it moves on the same roads and through the same crossings as the freight that burns it.
CBSA commercial wait times sat at 5 minutes at Pacific Highway, 4 minutes at Peace Bridge and 2 minutes at Queenston-Lewiston. Ambassador Bridge, Blue Water Bridge, Lacolle, Coutts-Sweetgrass and Emerson-Pembina were all clear.
Those are short waits. Five minutes at Pacific Highway is an ordinary Tuesday, not an event, and nothing on this board suggests a delivery problem working its way into the price.
For a driver the border number lands twice. Once in what the fill costs, because a delayed tanker eventually prices its delay into a drop. Once in your own crossing. If you run into Washington state through Blaine, Pacific Highway is your crossing and it carries the longest reported wait of the three ports showing one.
What you can do with this
Fuel on the cheap side of the provincial line when the routing allows it. The lowest litres on the board are Northwest Territories at 218.8 and Alberta at 247.3. Saskatchewan follows at 250.6. If your lane already touches any of those, work the fill into the plan instead of taking what the highway offers.
Check the city, not just the province. A provincial figure is an average by definition, and an average is not what the pump is doing on the street where you fuel. Montreal carries most of Quebec's truck traffic and it has its own page. Calgary does the same job on the Alberta side. Pull the city before you commit.
Use the exchange rate as a planning input. At 1.4064 the loonie is weak, and that sits under every province on the board. It is the one line on this page that no provincial policy can change.
Run the arithmetic on the lane you actually drive. The fuel cost calculator takes a distance, a burn rate and a price and returns the per-lane number, which is the figure that should decide where you fill.
The short version
The diesel price by province Canada table is going to keep throwing a wide spread, because the levers behind it are provincial by design. Tax rates, supply distance and local competition are not national policy. They are local facts, updated every week.
So check the board before you commit a fill. City-level diesel prices, live commercial wait times at every tracked crossing and a per-lane fuel cost calculator are all on the dashboard, free, with no login.
Sources: Natural Resources Canada weekly diesel survey (retail diesel, Tuesday print). Bank of Canada exchange rate series. CBSA border wait times. US Energy Information Administration weekly diesel price. Methodology, including how the national average is calculated: https://dashboard.northernmilemedia.com/methodology/nmdi/