California diesel is the dearest in the country at $8.082 a gallon
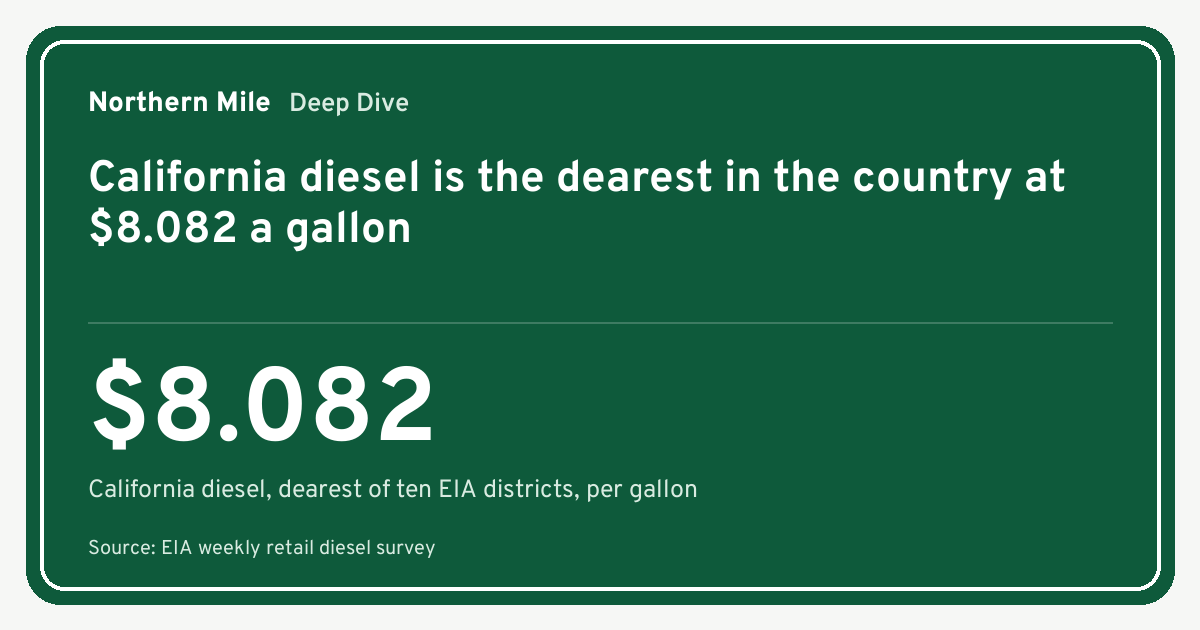
US diesel prices by state and region print as ten district averages. California is dearest at $8.082 a gallon and the Lower Atlantic cheapest at $5.699.

A driver asking what diesel costs in Texas wants a state number. The survey that could answer does not print one. US diesel prices by state and region arrive as ten district averages, and the district is the only figure the US Energy Information Administration (EIA) publishes.
That is not a technicality. It is the reason a lane plan should follow supply regions instead of state lines.
The map is drawn in ten districts, not fifty states
The EIA weekly retail diesel survey carries ten rows. They are not states and they are not laid out around highways. They follow how fuel actually moves, along pipeline routes, out of refinery clusters and through the ports that feed them. Every district reading sits on the US diesel page, priced in US dollars per gallon.
| District | Diesel, USD per gallon |
|---|---|
| California | 8.082 |
| West Coast (PADD 5) | 7.229 |
| West Coast excluding California | 6.490 |
| Central Atlantic (PADD 1B) | 6.485 |
| New England (PADD 1A) | 6.476 |
| Midwest (PADD 2) | 6.286 |
| Rocky Mountain (PADD 4) | 6.267 |
| US national average | 6.199 |
| East Coast (PADD 1) | 5.951 |
| Gulf Coast (PADD 3) | 5.819 |
| Lower Atlantic (PADD 1C) | 5.699 |
Source: US Energy Information Administration weekly retail diesel survey, week ending October 5.
Read the top of that board before the bottom. California leads at 8.082 a gallon and the Lower Atlantic sits lowest at 5.699. The national average of 6.199 lands between them, and that is the first thing to understand about a country-wide figure. It is no one's pump. A long haul that can choose where the big fill happens sees a menu here. One that cannot is buying whatever district it happens to be parked in.
Why US diesel prices by state and region are really district prices
The ten readings are not ten siblings. Two of them are parents. The East Coast at 5.951 is an aggregate holding New England, Central Atlantic and Lower Atlantic. The West Coast at 7.229 holds California and the rest of the Pacific coast. The survey publishes the big regions and the pieces inside them, so a state's published price is the price of the district it belongs to.
That is where a state number comes from. New England covers Connecticut, Maine, Massachusetts, New Hampshire, Rhode Island and Vermont. Central Atlantic covers New York, New Jersey, Pennsylvania, Maryland, Delaware and the District of Columbia. Lower Atlantic runs from Florida up through Georgia and the Carolinas to Virginia and West Virginia. The Midwest is the widest district, taking in Ohio, Michigan, Indiana, Illinois and the plains states out to the Dakotas and Oklahoma. Gulf Coast takes Texas, Louisiana, Arkansas, Mississippi, Alabama and New Mexico. Rocky Mountain holds Colorado, Idaho, Montana, Utah and Wyoming. West Coast excluding California carries Washington, Oregon, Nevada, Arizona, Alaska and Hawaii.
Pick any two states inside the same district and their published diesel price is identical this week. Texas and Louisiana both read the Gulf Coast figure. New York and Pennsylvania both read the Central Atlantic figure. The survey samples retail pumps across the whole district and prints the average for it, so the district is the finest resolution that exists. A state page shows that district figure and says so, which is what you see on Texas as much as anywhere else.
California is drawn on its own, and the survey shows it
California is the one district built from a single state. The EIA pulls it out of the West Coast instead of leaving it inside PADD 5, and the split comes down to supply. The state runs its own fuel specifications, and the pipeline network that carries Gulf Coast product up the eastern seaboard does not reach the Pacific. A market that cannot lean on the rest of the country for product prices itself.
The board shows the result. California prints 8.082 a gallon. The rest of the West Coast prints 6.490, and the coast as a whole prints 7.229. Same grade of on-highway diesel on every row. What changes is the district line and the supply map behind it, which is why the California page carries the highest number of the ten.
What the district line means on a lane
A district price is only useful when the lane lets you act on it. Take a run from Ontario into Michigan. The whole American leg sits in the Midwest, and the survey prints 6.286 for that district. Send the same trailer across into New York and it is standing in the Central Atlantic at 6.485. Push it out to the Pacific and it is in California at 8.082 or on the rest of the coast at 6.490. The load did not change. The district did, and the fill gets dearer as the map moves west.
Two rules keep that honest. US figures stay in dollars per gallon and Canadian figures stay in cents per litre, because the two do not convert into one clean number. And a district average is still an average. It tells you which way a market leans, not what the pump in front of you reads tomorrow.
The same idea runs north of the line
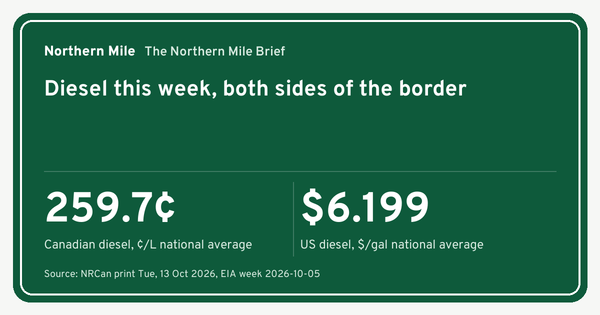
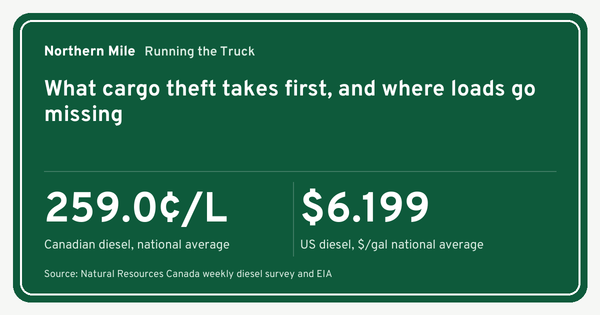
Natural Resources Canada prints diesel by province and territory rather than by district, and the shape of its map is just as marked. The national average is 259.7 cents a litre on the print dated Tuesday, October 13. Quebec is dearest at 291.2. The Northwest Territories is cheapest at 221.8. The spread between them is 69.4 cents a litre, and that gap moves a fuel plan more than the national line does.

Diesel prices by province and territory, against the ten-province national index, per the NRCan weekly survey.
The mechanism repeats. Product has to travel, and the farther a market sits from supply, the more the last leg costs. Taxes stack on top of that, market by market. The expensive end is coastal and eastern, where Quebec, Newfoundland and Labrador, the Yukon and British Columbia all sit at the top of the board. The cheap ground runs through the middle, with Alberta and the Northwest Territories at the bottom and Manitoba and Saskatchewan just above them.
The currency and the clock
Two more numbers decide what a cross-border week costs. The Bank of Canada noon rate put the loonie at 1.4222 Canadian dollars to the US dollar on October 13, a move of 0.3 per cent in the Canadian dollar's favour. Crude is priced in US dollars, so a stronger loonie softens pump pressure on this side of the line. A weaker one does the opposite, and that swing reaches every litre a cross-border fleet buys.

The Canadian dollar against the US dollar, recent observations.
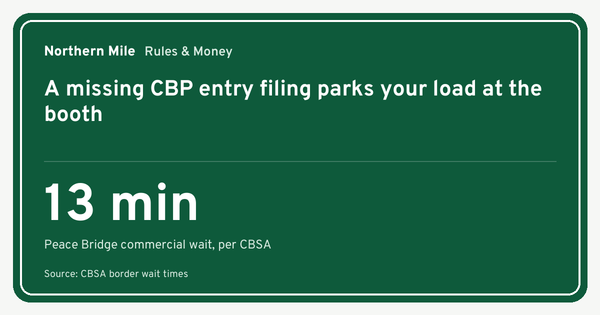
CBSA reported commercial delays at three crossings. Peace Bridge is slowest at 13 minutes, then Queenston-Lewiston Bridge at 7 and Pacific Highway Crossing at 5. Ambassador Bridge, Blue Water Bridge, Lacolle, Coutts-Sweetgrass and Emerson-Pembina all read clear.

Current commercial wait times at CBSA-reported crossings.
A queue is fuel burned at zero miles and hours the next appointment does not get back. The Ambassador Bridge is the crossing most Ontario fleets plan a day around, and a clear reading there is worth more than the minutes suggest.
What to do with the map
Price the district, not the state. Where a lane allows one big fill, the Gulf Coast and the Lower Atlantic hold the cheap end of the US board this week, and the Midwest is cheaper ground than the Central Atlantic.
Treat the national average as context. It tells you the direction of the market, not what your fill costs. The north side of the line makes the same point, and there the provincial spread of 69.4 cents a litre is the figure that changes a plan.
Run your own arithmetic. Cost per kilometre is your burn rate multiplied by the price where you actually buy, and only one half of that is published here. The fuel cost calculator takes your own figure and runs the lane in front of you.
US diesel prices by state and region only make sense once the district is the unit. Ten districts, one country, and a bill that changes with the map. Every district reading and every live crossing wait sits on the dashboard, and your own lane is one calculation away from a number a dispatcher can use.
Sources: Natural Resources Canada weekly diesel survey, Bank of Canada Valet API, CBSA border wait times, US Energy Information Administration weekly retail diesel survey. Methodology at https://dashboard.northernmilemedia.com/methodology/nmdi/.