Where freight cost lands across North America's corridors
Quebec printed 291.2 cents a litre, the Northwest Territories 223.8. The North American freight corridor data splits fuel cost from border delay.

Freight does not cost the same everywhere. The province a truck fuels in changes the bill. The crossing it queues at changes the clock. Read the North American freight corridor data this week and you get two maps of one continent, one for fuel and one for delay. The regions that carry the heaviest burden show up on both.
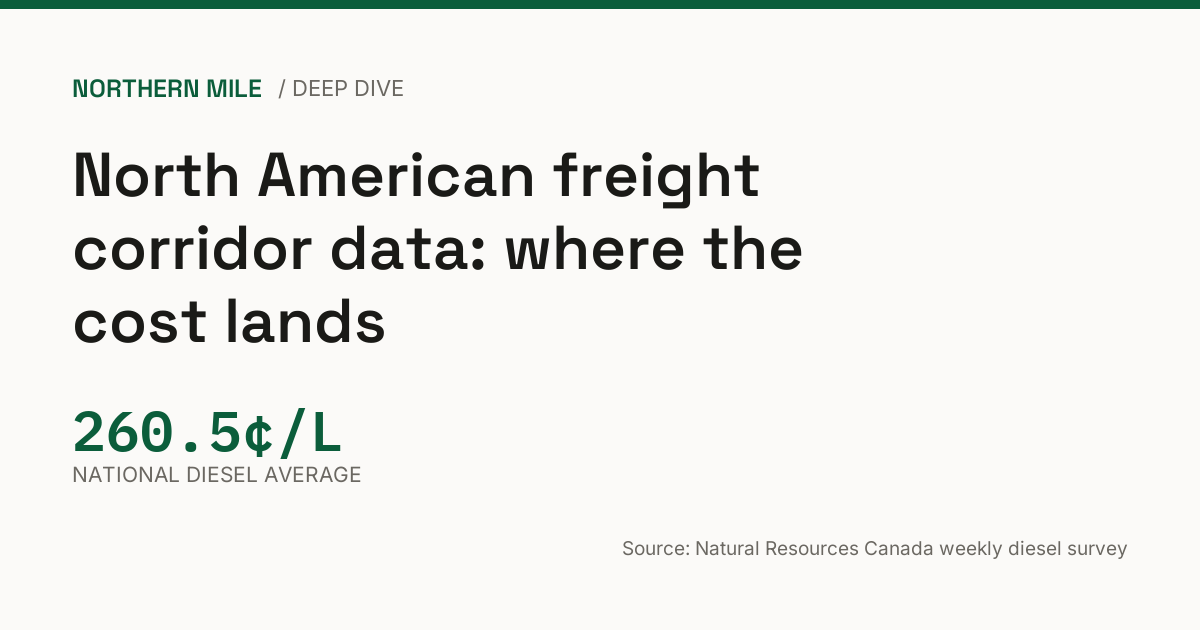
Natural Resources Canada printed the national diesel average at 260.5 cents a litre on Tuesday, October 6. Quebec sits highest at 291.2. The Northwest Territories sits lowest at 223.8. The gap between them is 67.4 cents a litre, and that gap moves a fuel plan more than any national headline does.
The spread is the story, not the average
A national average flatters a route. It is the mean of very different numbers, and no truck fuels at the mean. What a driver pays is set by where they buy, not by the line at the top of the page.
Quebec runs dearest in the country at 291.2 cents a litre. Newfoundland and Labrador follows at 272.2. Yukon prints 269.9, New Brunswick 269.3, British Columbia 268.8. Those four sit above the national average of 260.5, and Nova Scotia at 266.8 sits just above it too.
The cheap end looks like a different country. Alberta prints 235.4. Manitoba prints 246.0 and Saskatchewan 247.7. The Northwest Territories prints 223.8 and takes the low mark. Every one of those numbers is tracked week by week on its own province page, and the Quebec page is the one to watch if you fuel east of the Ontario line.

Provincial diesel prices against the national index, per the NRCan weekly survey.
The pattern is distance and tax. Fuel moves by pipeline, rail and truck before it reaches a pump, and the farther a market sits from the supply, the more that last leg costs. Provincial taxes stack on top of each other and differ market to market. The territories run their own arrangements, which is why the cheapest diesel in the country sits at the top of the map rather than the bottom.
Read that as an operating fact, not trivia. A long haul fleet that runs Ontario to Quebec crosses a line where the diesel gets dearer. The tank you top before the line is the cheaper tank. A western run into Alberta goes the other way, and the refuel gets cheaper as the miles stack up. That is real money on a 500 litre fill, and it repeats every week.
North American freight corridor data: the comparison, region by region
Here is the full board, exactly as NRCan published it on October 6.
| Region | Diesel (cents per litre) |
|---|---|
| Quebec | 291.2 |
| Newfoundland and Labrador | 272.2 |
| Yukon | 269.9 |
| New Brunswick | 269.3 |
| British Columbia | 268.8 |
| Nova Scotia | 266.8 |
| Prince Edward Island | 254.9 |
| Ontario | 252.3 |
| Saskatchewan | 247.7 |
| Manitoba | 246.0 |
| Alberta | 235.4 |
| Northwest Territories | 223.8 |
Five regions print north of 266. Ontario, the freight spine of the country, prints 252.3. Alberta, where a great deal of the fuel starts, prints the lowest of the provinces at 235.4. The fuel travels toward the higher price, not away from it.
Read the ranking as a corridor map. The freight that runs the Windsor to Quebec City axis pays one of the highest provincial rates in the country for most of its miles. The freight that feeds the British Columbia ports carries the coastal premium. The prairie corridors out of Alberta and Saskatchewan run on the cheapest fuel on the board. Same trucks and same loads, a different fuel bill depending on which end of the line you stand on.
The border side of the map
Fuel is one half of the corridor. The other half is the crossing.
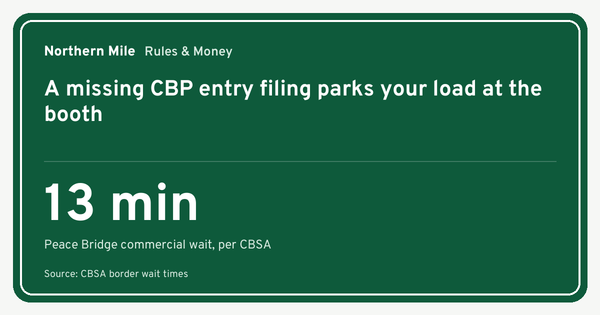
CBSA reports on nine crossings this week. Three carry a delay today. Peace Bridge is slowest at 13 minutes. Queenston-Lewiston Bridge sits at 7 minutes. Pacific Highway Crossing sits at 5 minutes.
Five crossings are clear: Ambassador Bridge, Blue Water Bridge, Lacolle Border Crossing, Coutts-Sweetgrass and Emerson-Pembina.

Current commercial wait times at CBSA-reported crossings.
That split matters more than the minutes suggest. A 13 minute wait is nothing on a single run. Repeat it across a fleet and a week and it is the difference between a tight schedule and a blown one. The load does not care about the queue. The appointment does. If you run the Niagara corridor, the Peace Bridge page carries the wait as it moves, and the Pacific Highway Crossing page does the same on the west coast.
The mechanism is plain. A crossing is a choke point. Every commercial unit on that lane passes through the same gate, and when the gate slows, the queue grows behind it. CBSA publishes the wait in minutes, and minutes are the one input on a schedule a driver can check before they commit to the run. That is why the delay feeds carry as much weight as the price feeds.
Both sides of the line
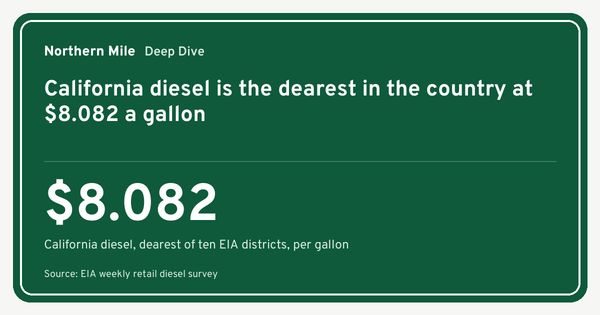
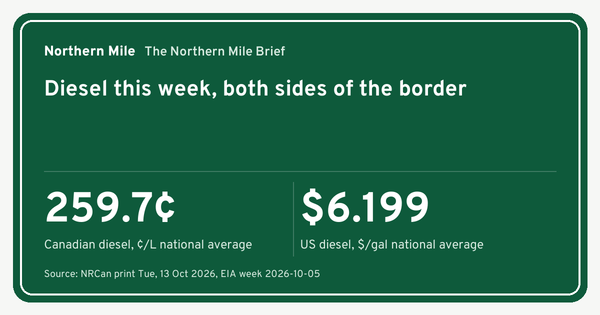
This is a continental map, and it has to be read honestly. Canada reports diesel by province. The United States, through the Energy Information Administration, published one national figure this week, 6.199 US dollars a gallon on October 5. That is the American side of the corridor data as it stands. The district by district American split is not in this week's brief, and no amount of good intent turns one national number into ten regional ones.
So the continental read here is directional, not a head to head ratio. The two currencies and the two units do not convert cleanly into a single figure, and this dashboard will not fake one. What it will do is show the Canadian side in full and name where the American side stops.
The currency sits behind that gap. The loonie printed 1.4226 against the US dollar on October 6 and strengthened 0.20 per cent on the day. A stronger Canadian dollar softens pump pressure on fuel priced in US dollars, and over a month that move reaches every litre a cross border fleet buys.

The Canadian dollar against the US dollar, recent observations.
What this means behind the wheel
Plan the fill, not just the route. If a run crosses from Ontario into Quebec, fuel on the far side costs more, and the tank you top before the line is the cheaper tank. If it runs west into Alberta, the refuel gets cheaper as you go.
Watch the queue, not just the crossing. Peace Bridge at 13 minutes is the slow one today. Pacific Highway Crossing at 5 minutes is lighter. On a tight appointment, that difference is worth a phone call and a small detour.
Treat the national average as context, not a budget line. It tells you the direction of the market. Your own cost per kilometre is your burn rate times the price where you actually buy, and the fuel cost calculator runs that arithmetic for the lane in front of you.
Build the fill and the crossing into one plan. The cheapest fuel is worth little if it sits behind a 13 minute gate on an appointment that cannot move. Read the two feeds on the same day, and pick the tank and the crossing together.
What is next
Watch the two feeds together. The diesel spread has been wide all fall, and the coastal premium is not a one week event. On the border, the delay is sitting on the Niagara corridor and the Pacific Highway this week. Three British Columbia highway incidents are flagged as major by the road feeds, which matters if any of your lanes run the interior. None of the 15 news headlines this week carried a Canadian flag, so the macro board is being read off the data, not the press.
The short version
The fuel map says where the cost lands. The border map says where the time goes. Both are regional, and both reward a driver who plans around them.
The North American freight corridor data is not one number. It is a set of local ones, and the local one is the one you pay. See every regional diesel price and every live crossing wait on the dashboard, and run your lane through the fuel cost calculator before the next load.
Sources: Natural Resources Canada weekly diesel survey, Bank of Canada Valet API, CBSA border wait times, US Energy Information Administration. Methodology at https://dashboard.northernmilemedia.com/methodology/nmdi/.